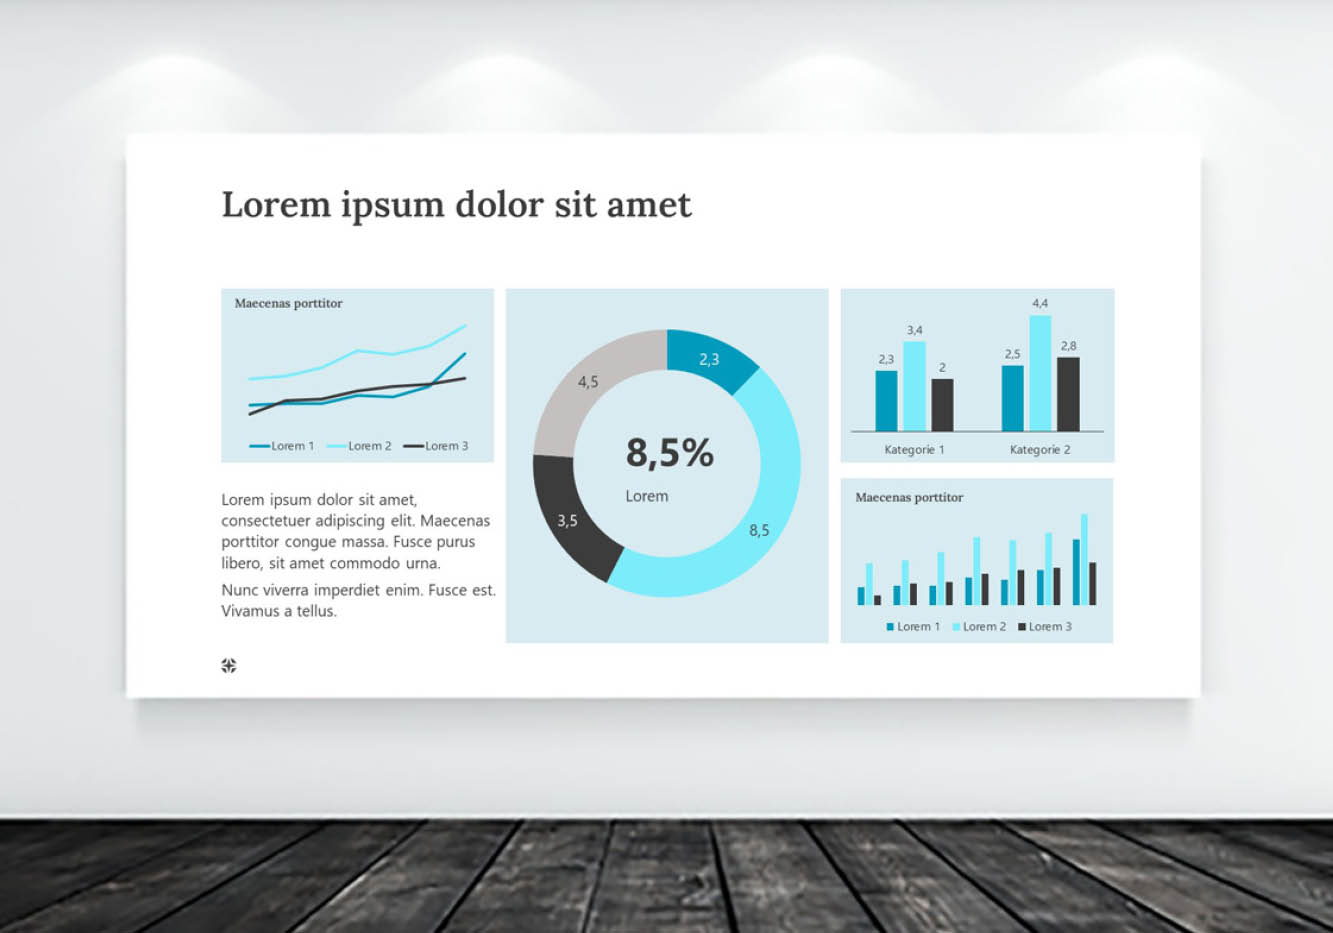
CEO Achim Sztuka outlines the latest data visualization features in PowerPoint add-in QuickSlide. Find out about new functions and impress your audience with clearly presented charts.
Tag: Data visualization

The step-by-step approach to data visualization in presentations
How can larger volumes of data be used to paint an informative picture? In five steps, we’ll explain what you need to remember when creating charts, diagrams, and graphs.

Visualizing data through charts
The ability to make figures visual is the mark of a good presentation. But there are some pitfalls that need to be avoided here. Read on to find out more.

Data display formats
There are many ways to convey your facts and figures using graphic elements. We help you find the right data visualization format quickly and easily.

Tips for clear PowerPoint slides
Create clear PowerPoint slides! Avoid cramming too much information on one slide for clear statements

Which visualization for which message?
There are many ways to convey your facts and figures using graphic elements. We help you find the right data visualization format quickly.
