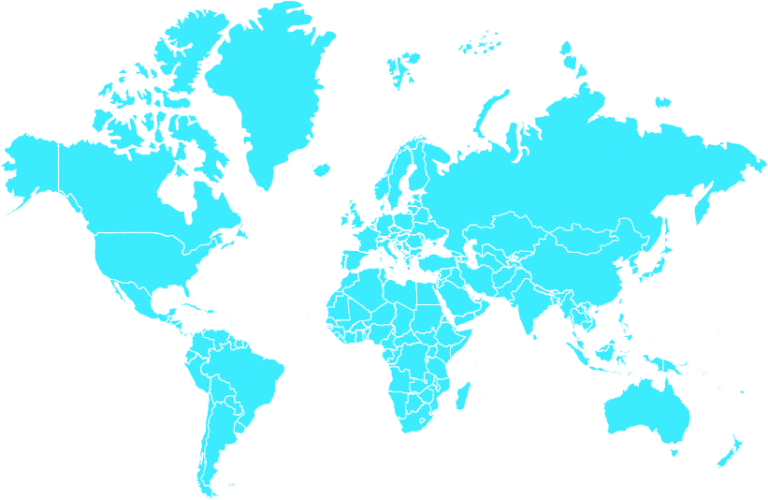
Free PowerPoint maps
The whole point of PowerPoint is for people to quickly be able to create visual combinations of text and graphics, and later use these to convey clear, convincing messages. PowerPoint maps that are visually integrated into a presentation are one particularly exciting, but not always easy-to-use, form of graphic material. They assign figures and texts to specific regions, often replacing things like complicated tables and charts. Free, editable map templates for PowerPoint can be helpful in quickly and efficiently creating attractive maps graphics for your next presentation.
Sales and management presentations in particular often need to present country-specific aspects, such as visualizing a company’s worldwide locations, or even just highlighting the countries in which new branches have been opened. Sales figures frequently also need to be shown by country or region. This is all easily done using a table, which is undoubtedly most practical for the person creating the presentation; all they have to do is copy their Excel data to PowerPoint. Find out how to import your data easily and automatically into PowerPoint using our QuickSlide software solution here.
But these sorts of tables aren’t necessarily very attractive, and will hardly convince your audience. Maps integrated into PowerPoint, on the other hand, allow regions such as EMEA or North America and associated information to be sorted perfectly and presented in a highly visual manner.
The advantage here is clear: One single map can be applied as an infographic to convey all kinds of information to the audience at just a glance, making it much more concise and incisive than mere text, and allowing it to be used in a variety of areas. But as is so often the case with useful aids, integrating and creating PowerPoint maps is anything but self-explanatory. Many users ask if it’s possible to integrate Google Maps into PowerPoint. Another common workaround is to insert PNG or JPG files featuring a map section. This is then “enriched” with additional information in a text box. Even PowerPoint itself now offers editable maps (these are a separate type of chart, and can be selected and inserted just like any other chart). While this has the potential to be a great tool, it is still, at the time of this blog post’s publication, yet to be fully developed, and is thus complicated and not sufficiently robust.
Any user applying these workarounds is likely to have wondered, on numerous occasions, whether any good, freely editable map templates exist for PowerPoint. The common feedback, however, is that it is impossible to find any (decent) maps to integrate into PowerPoint, or that the map material is not uniform. When searching online, you often also stumble upon outdated or paid map material, which is why we want to use this blog entry to provide you with a number of helpful, free map templates for your PowerPoint presentation.