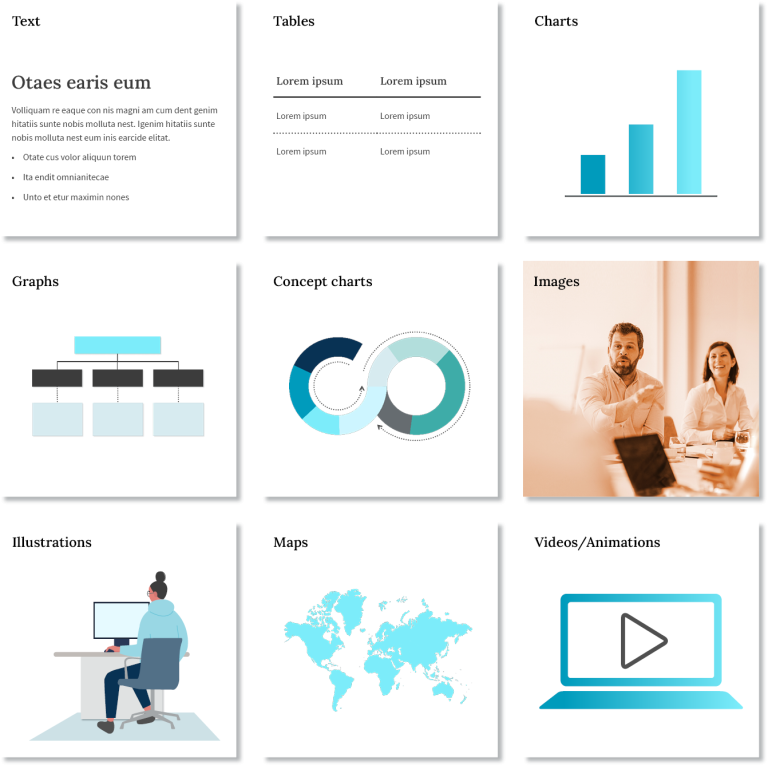
There are numerous ways to illustrate your messages in PowerPoint using graphics. Here we’ve summarized various visualization types, plus a few usage tips, to help you find the right one for your needs quickly and easily.
A clear text structure helps your audience understand your presentation. Break up long lists under separate, logical headings. Use as few words as possible and avoid continuous text. Otherwise, your audience will be concentrating on the slide rather than on you, the speaker.
Only use tables when you really need to show and discuss specific data. Some situations, e.g., trends, can be communicated much more effectively using charts. If you do use a table, show only the most relevant data, so that the slide is easy to read and understand.
For tips on choosing the right type of chart, see our separate blog post. Charts are ideal for revealing data relationships. You can highlight important aspects, such as a change in trend or a phase of continuous growth, with appropriate formatting.
Diagrams use nodes and connecting lines to display relationships between several elements. Examples include organigrams, family trees or route maps for public transport. To make them easy to follow, ensure similar elements show the same formatting, e.g., use the same size and color for those showing members at the same responsibility level on an organigram.
Concept charts illustrate processes and the relationships between elements in a system. To find the right type of chart, use the key words in the text as a guide. For example, ‘”in three steps” or “in four phases” would indicate you need to use a process arrow chart.
With well-chosen pictures, you can catch your audience’s attention, and make your presentation more appealing and convincing. Remember, less is more. Leave out merely decorative images and use a few, carefully selected images that underscore your content.
Graphics, such as pictograms, are symbolic representations of objects or information. They can also help to structure presentations and guide the audience through complex topics.
If you want to illustrate geographical relationships, customized maps enable you to highlight precise regions. Google Maps and other mapping software can also be very helpful here. For example, you can position the logos of your customers or competitors on the map.
Targeted, minimal use of animations allows you to build up complex illustrations step by step. Embedded videos can be an effective way to anchor messages and let others contribute or have their say.